Decoding the World of Sound: AI Spectrogram Analysis for Identification, Categorization, and Soundscape Mapping
This technology is at the heart of how Viibe devices not only capture environmental sounds but also interpret them—identifying specific noises, categorizing them into types, and even mapping out "soundscapes" to highlight pleasant or offensive auditory environments. Whether it's the soothing chirp of birds or the grating roar of traffic, AI helps us make sense of the sonic world around us, empowering better urban planning, conservation efforts, and public health initiatives.
In this post, we'll break down how spectrograms work, how AI leverages them for sound recognition, and how this leads to innovative heat maps that visualize the quality of our sound environments.
What Are Spectrograms and Why Do They Matter?
At its core, a spectrogram is a visual representation of sound. It transforms audio signals into a 2D image where the x-axis represents time, the y-axis shows frequency, and color intensity indicates the amplitude (loudness) of those frequencies. This "heatmap" of sound allows us to see patterns that are invisible to the ear alone—like the unique frequency signatures of a car engine versus a bird call.
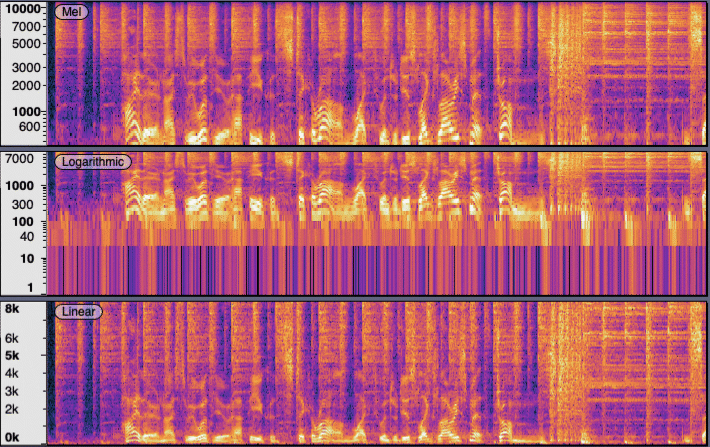
Spectrograms are generated using techniques like the Short-Time Fourier Transform (STFT), which breaks audio into short segments and analyzes their frequency content. Tools like Python's librosa library make this process efficient, turning raw audio from Viibe Hubs into images ready for AI analysis. This visual format is crucial because it converts complex audio data into something machine learning models can "see" and process, much like how computer vision handles photos.
In environmental monitoring, spectrograms reveal hidden details: low-frequency rumbles from machinery, high-pitched insect buzzes, or the harmonic structures of human speech. By capturing these in real-time via Viibe's MEMS microphones and DSP, we lay the foundation for advanced AI insights.
AI-Powered Sound Identification and Categorization
Once we have a spectrogram, AI takes over. Models like Convolutional Neural Networks (CNNs) or pre-trained systems such as Google's YAMNet treat the spectrogram as an image and classify it based on learned patterns. During training, the AI is fed thousands of labeled spectrograms—e.g., "traffic noise," "birdsong," or "construction"—allowing it to recognize features like frequency bands, duration, and intensity variations.

For identification, the AI outputs probabilities: "This sound is 95% likely a dog bark." Categorization goes further, grouping sounds into broader types, such as natural (wind, water), anthropogenic (vehicles, alarms), or biological (animals, voices). Advanced models can even handle overlapping sounds using techniques like multi-label classification or source separation.
In Viibe's cloud-based system (powered by AWS SageMaker), this happens in real-time. A hub captures audio, generates a spectrogram, and the AI categorizes it—flagging offensive sounds like jackhammers for alerts or noting pleasant ones like rustling leaves for positive feedback. This not only identifies "what" the sound is but also "why" it matters, based on context like time of day or location.
The result? Actionable data: Governments can enforce noise regulations, industries can mitigate disruptions, and communities can advocate for quieter spaces.
Creating Sound Heat Maps for Pleasant or Offensive Soundscapes
Taking it a step further, AI spectrogram analysis enables the creation of sound heat maps—geospatial visualizations that overlay sound data on maps. By aggregating categorized sounds from a network of Viibe Hubs, we can color-code areas based on their "soundscape quality."
Pleasant soundscapes might be shaded in cool greens and blues, representing calming elements like ocean waves or forest ambiance, which promote well-being. Offensive ones could appear in warm reds and oranges, highlighting stressors like constant traffic or industrial clatter, linked to health issues such as sleep disturbance or anxiety.
The process involves:
- Data Collection: Hubs triangulate and categorize sounds using TDOA and AI.
- Aggregation: Over time, sounds are scored (e.g., +1 for pleasant, -1 for offensive) and interpolated across the area using geospatial tools like GIS software.
- Visualization: Tools like Amazon QuickSight generate heat maps, showing gradients of sound quality.
For example, an urban park might show a pleasant core surrounded by offensive edges from nearby roads, guiding planners to add sound barriers. These maps are dynamic, updating in real-time to reflect changes like seasonal bird migrations or construction projects.
Wrapping Up: The Symphony of AI and Sound
AI spectrogram analysis is revolutionizing how we understand and interact with our auditory environments. By identifying sounds, categorizing them, and mapping their impact, Viibe Hubs turn noise into knowledge—helping create healthier, more harmonious spaces.
What sounds define your daily life? Share in the comments! For more on integrating this tech with Viibe, visit our Stay tuned for our next post on air quality synergies with sound monitoring. Let's keep vibing toward a better world!